
Summary
- In US total market and Austin, TX, historically a long period of stagnation in peak housing prices has followed a major boom that deviated from historical trends.
- Housing valuations went up by as much as 3 folds following the housing mania of 2020-2022 due to various reasons including lowered supply, investor buyers, artificially low interest rates, and work-from-home flexibility.
- Sky-high valuations and unrealistically high asking prices may drop by as much as 50% from their peaks in different parts of the country, and some listings already show as much as 40% reduction in original asking prices.
- Historical pricing data can be used to filter out the noise and determine fair housing value.
- For fair housing valuation, historical data indicates that it is unlikely for housing valuations to stagnate or be nominally negative for longer than 6 years.
- Calculator at the end of the article helps in estimating if or when your property becomes an asset.
We saw a housing mania following the 2020 lockdowns where home prices were double or tripled over the course of 2 years. This massive boom in the housing market was fueled by various factors including artificially low interest rates, lowered housing supply due to partial shutdown of the economies, institutional investors bidding up prices, and work-from-home (WFH) flexibility pushing people to different areas or even cities or states. In 2022, the average buyer moved 50 miles away from their previous residence, corresponding to roughly a 200% increase from previous years.

The late stages of the mania was becoming apparent when the bidding wars were raging and some properties were routinely being sold over 20% higher than asking price. Some users on Twitter shared their experiences of the housing mania in various parts in the country:
A home that sold near me in Nov 2021 for 760k and relisted in March 2022 for 825k, then sold for 840k. Original Nov. buyer never moved in or renovated a thing. Sat on it 4 months and made 80k. I wasn't prepared for how insane the Spring rate lock blow off top would be
40k over asking $430k, 900 sq Ft. Waving inspection, buying sight unseen, covering enormous appraisal gaps with cash and a 3 month rent back. Madness.
Waited 2.5 hours on an open house line in pouring rain with clients in Clifton, NJ $400K house.
Listing agent received exactly 100 offers.
The fear of missing out (FOMO) surrounding the housing mania is understandable since purchase of a house (condo, co-op, etc) as primary residence is generally the biggest financial expense or investment a household makes in their lifetime. This can make the decision surrounding the purchase very emotional. But whether the residence actually becomes an asset or a liability can depend on many factors including the profitability of the property, household financials, and market conditions.
Since housing markets can be highly localized, this article uses data from both total US transaction history as well as a single city for comparison. The chosen city in this article is Austin, Texas (ATX), for multiple reasons including
- It is home to a cluster of tech companies including Apple, Amazon, Google, AMD, ARM, Intel, Oracle, IBM, NXP, Tesla, and others. It has earned the nickname 'Silicon Hills' analogous to Silicon Valley.
- Multiple times Austin was listed as the top 10 cities to live in.
- It was home to a massive housing mania during the 2020-2022 period.
An Asset or a Liability?
Even though a primary residence is generally seen as a safe investment and an asset, that is not always the case. Rich Dad Poor Dad argues that a house is not an asset, but a liability since it takes money out of your pocket (see the book for full reasoning). We argue that it lies in between and can vary case to case.
In the current market with multi-decade high inflation, or record high inflation when using 1980s-based CPI calculation, some argue that "cash is king". But the reality is that savers are losing roughly (officially) 10% per-year (compounding) of their savings via the loss of their purchasing power throgh the devaluation of the currency. Coupled with 20-40% increase in rental prices some cities have experienced this year, one may argue that a house can be instead be a store of value.
Note, however, that with highest inflation also comes increase cost of ownership including higher interest rates, higher homeowner insurance, and higher maintenance costs. Example set of expenses associated with maintenance of an aging house can be significant. For example, some estimate of the cost of large ticket items for a property is included below
- Roof replacement: $15k
- Pipe leaks: $15k
- New HVAC: $10k
- Foundation repair: $10k-$20k
- New septic tank: $7k
Current sky-high housing valuations coupled with higher total cost of ownership require extra care when committing to purchasing a home. If the property is not purchased at a fair value, then the property can very quickly become a liability.
Fair Value
During a mania entrenched in FOMO and speculation, fundamentals are and fair values can get ignored leading to temporary artificially high valuations. This was especially true during the recent housing mania where the appraised values of all properties were pushed up unrealistically high in bidding wars. Looking at nearby comparable properties for coming up with an estimate of a fair value may work during a buyers market. But during a sellers-market, or when a housing mania is starting to cool-off, there it can lead to over-paying for a property.
An alternative approach may be looking at the long-term housing trends of the same property, neighborhood, or the city as a whole to come up with an expected (nominal) growth rates of the property. Figure below shows the housing price indices from all US transactions along with Austin, Round Rock, and Georgetown, TX (hereon referred to ATX) from the U.S. Federal Housing Finance Agency (FHFA). Note the large growth in the US price index leading up to the 2008 great financial crisis (GFC) which was not as pronounced in ATX data.

The price history seems to indicate four separate growth periods
- 1970-1990
- 1990s leading up to the 2008 housing bubble
- 2012-2020 coming out of the housing bubble fueled by low interest rates
- 2021 housing mania fueled by excessive liquidity injected into the economy leading to record high inflation
Each period has a different nominal growth rates highlighted in the following table.
| Period | Years | Appreciation Rate (%/year) | |
|---|---|---|---|
| ATX | US | ||
| 1975-1990 | 15 | 3.5 | 6.9 |
| 1990-2011 | 21 | 6.3 | 10.4 |
| 2011-2021 | 10 | 20.3 | 17.7 |
| 2021-2022 | 1.5 | 121.1 | 98.4 |
| Mean (1975-2021) | 10.0 | 11.7 | |
The increasing growth rates in various different cycles visible in the data may be due to increased growth rate (e.g. more tech companies moving to ATX thereby increasing the household income), higher inflation, or a combination of the two. If we look at the average of the four time periods (i.e. excluding 2021-2022 time period), housing price index averaged at a nominal rate of 11.7% per year.
We can use these historical trends for estimating the future value of a property, or coming up with a current fair market value of a property in midst of a housing mania.
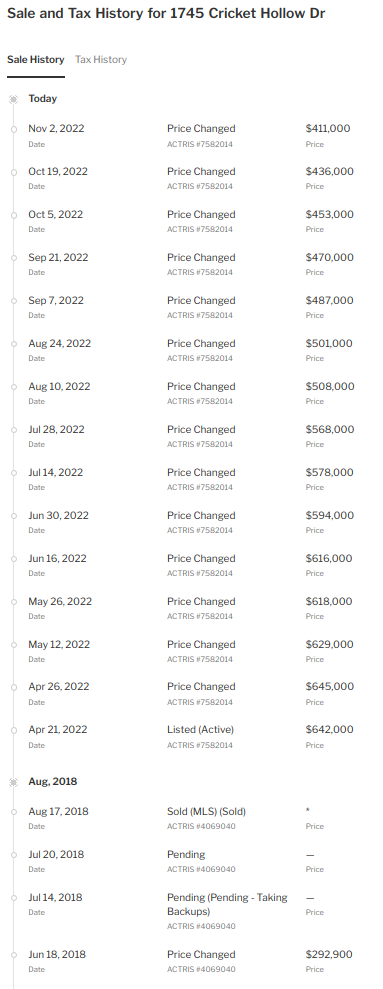
As an example for coming up with some value for a fair value, consider this property in Austin, TX. Based on the pricing history displayed on Redfin, this property was likely sold for $295k on April, 2018. Four years later in 2022, it was re-listed for sale for $642k. That is a 117% increase in sale price in four years, or roughly 30%/year (not compounding). While an effective 30% nominal growth rate is possible for hidden gems, that is not the case here. If you look up the publicly available deed history of the property from the local appraisal district you'll notice that the property was actually sold to Opendoor in late 2021 at the peak of the housing mania and Opendoor was looking to take advantage of the hot market for a quick flip and large profit. Also from the publicly available appraisal records, we can see that the property was appraised to be $285,958 for 2019 and 2020 tax years prior to the housing mania.
If we were to apply the historical trends, the estimated fair value of the property (at the time of its listing) using historical trends shown above would be
- Conservative: $285,959 ✕ (1 + 0.067 %/year ✕ 2 years) = $321,989
- Mean: $285,959 ✕ (1 + 0.10 %/year ✕ 2 years) = $343,151
- Aggressive $285,959 ✕ (1 + 0.23 %/year ✕ 2 years) = $417,500
This above estimates assume that the property is in good condition and has no required major repairs such as foundation issues, roof repairs, etc. As of this writing, the above property is still listed for sale, and the original asking price has been reduced by roughly 36%, down to $411,000. This falls within in between our our mean and aggressive model estimates.
Note also that our historical growth rates were determined over "longer" time horizons (over 10 years) and they average out any short-term devaluation or stagnation periods. In fact, the housing market in ATX looks to have stagnated for over 9 years during the 1990s with little to no growth. The extent of this period in the total US housing market was not as pronounced. Similarly, following the GFC crisis, the total housing market in the US saw a stagnation period for over 10 years. This time period and its extent in ATX was noticeably less pronounced.

These are important points that are worth highlighting. During a boom and bust cycle:
- In the US and ATX, a long stagnation period has followed any large boom that deviated from historical trends.
- The value of a property may depreciate or stagnate for multiple years.
- Housing markets tend to be localized.
If your time horizon is long enough, then stagnation and devaluation have historically been only paper losses a non-issue. However, if a property was bought at artificially high valuations (e.g. during a housing bubble) which was then followed by multi-year stagnation period and the purchasers are forced to sell in the short term, then considerable losses may be realized.
Future Projection and Risks
An estimate of the downside risk of loss of value of a property may be obtained by revisiting the the multi-decade long historical trends. For example, an estimate for the 1-year worst case scenario for the change in valuations in the US market as a whole would be (1+0.117*2)/(1+0.984) - 1 = -42.64% . Table below summarizes how the future valuation of the price indices may change if it were to trend down to its previous historical trends using different historical growth rates.
| 1 year projection | ||
|---|---|---|
| Condition | ATX | US |
| Worse | -50% | -43% |
| Average | -43% | -38% |
| Best | -34% | -32% |
We can get comparable numbers for by looking at the household US median price to house-hold income ratio which reached an all-time high in 2022. The mean of the ratio is around 5 and the current ratio stands at around 7.6.

Note that the example shown in the preceding section so far has seen a total of 36% drop in listed price. These high reduction in the current valuations is unlikely to be applicable to properties that were purchased closer their associated fair value.
Even if a property was bought at fair value (see previous section) there is still a future risk of depreciation or stagnation of property valuations. A crude estimate for the likelihood of the maximum depreciation or loss of value of a property in a year may be found by once again using the historical price index. Looking back at both the total US and ATX historical data, an estimate of 1 year loss of value is roughly -11% and -5%, respectively, if we look at the 5% percentile of the year-over-year change.

Note that these estimates do not consider the current and future market conditions For example, sellers are generally also buyers, so they would need to give up their existing low interest rates for much higher interest rates, which may in turn lower available supply.
Assuming fair value purchase price, we can also get an estimated projection of potential normalized annual loss using simple stochastic models. Assuming a constant mean and variance from the historical price index data, the likelihood of the estimated loss of value a property in within the next 1, 2, 4, and eight years with a 95% confidence interval are displayed in the figures below. These estimations indicate that the estimated likelihood of nominal loss of value is roughly 0% with a 95% confidence interval after a ~6 year time-horizon.


| VaR (%/year) | ||
|---|---|---|
| Years in future | ATX | US |
| 1 | -7.3 | -2.7 |
| 2 | -3.6 | -0.6 |
| 4 | -1.1 | +1.0 |
| 8 | +0.9 | +2.2 |
Estimating Future Profits
Let's return back to an earlier question: is a house an asset or a liability?
We can estimate the return (or loss) on investment (ROI) in the future with a sufficiently large time horizon. Our investment is the total money spent, and it includes down payment, principal and mortgage interest, estimated maintenance expenses, taxes, sellers agent fees at the time of sale, etc.
The calculator below includes takes as input these expenses, and estimates the total profit you may realize in the future using an inputted projected average annual appreciation rate.
Here's a few tips when using the calculator below:
- Consider and include closing costs
- If you are planning on holding on to a single-family-home (SFH), be realistic when estimating monthly expenses. A simple rule of thumb you can use is to set the total maintenance cost per year to be 1% of the purchase price.
- Consider any costs associated to remodeling that you may want to do.


